Disclosure: Isaiah Steinberg is a part of the research team for this study. This is a report on the findings of the study from the research team.
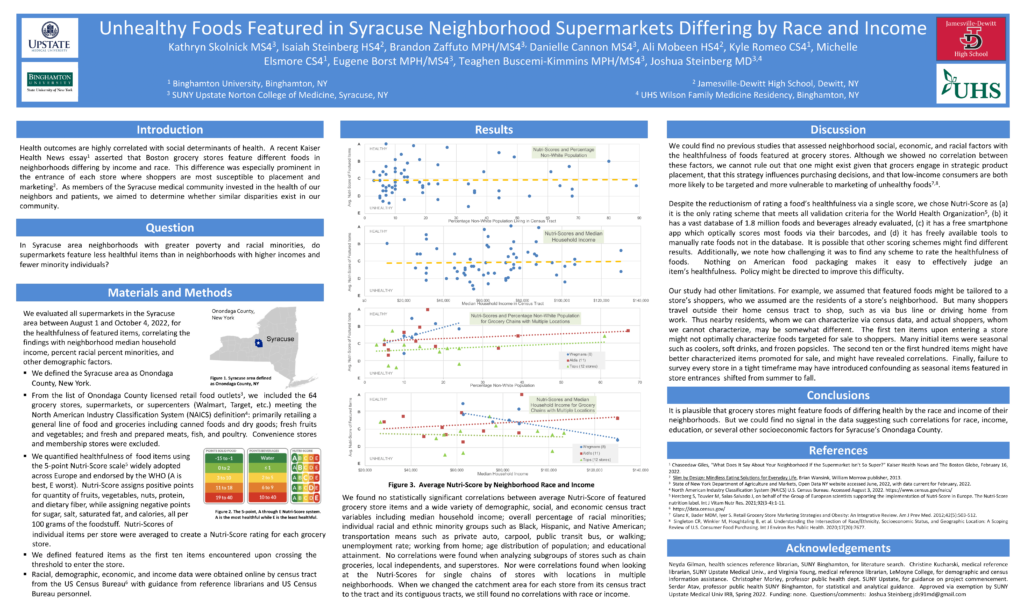
Researchers from Upstate Medical University, United Health Services, SUNY Binghamton, and Jamesville-DeWitt High School presented the interim findings of a research project at the annual Family Medicine Education Consortium (FMEC) meeting in Arlington, Virginia in September 2022. The study was an empirical analysis of the social determinants of health in Upstate New York – the socioeconomic factors that contribute to one’s health and well-being. Under the premise that grocery stores feature high-margin items at the front of stores, the study examined whether grocery stores feature food and beverage items of different health levels in different neighborhoods. Essentially, in Syracuse area neighborhoods with greater poverty and racial minorities – do grocery stores feature less healthful items than in neighborhoods with higher incomes and fewer minority individuals?
The researchers concluded that, in reality, grocery stores do not feature less healthful items in socioeconomically disadvantaged neighborhoods. To come to this conclusion, the researchers examined every grocery store in Onondaga County – 67 in total.
What makes a grocery store? According to the government-endorsed North American Industry Classification System, a grocery store is “primarily engaged in retailing a general line of food, such as canned and frozen foods; fresh fruits and vegetables; and fresh and prepared meats, fish, and poultry.” The researchers excluded subscription warehouse clubs such as Costco, as well as convenience stores such as those found at gas stations. Walmart and Target stores were included due to the high number of Americans who get groceries at these stores.
To determine which items were featured, the researchers recorded the first ten items in proximity to the store entrance, including the atrium, if there was one. Next, the Nutri-Score of each item was recorded using a combination of scanning barcodes and manually calculating the scores. Nutri-Score is a food rating scale widely adopted across Europe and endorsed by the World Health Organization. It rates food and beverages from A to E, with A being the best and it going down from there.
For their preliminary findings presented at FMEC, the researchers gathered data on the median household income and percent minority (including Hispanic people identified as white in the Census) for each census tract. They averaged the Nutri-Scores of the first ten items in each store, then compared the average Nutri-Score for each store to the demographic data of the census tract from the area where the store is located. Based on these variables and the first 41 stores surveyed, the researchers found no correlation between census tract median household income and average Nutri-Score, nor between census tract minority percentage and average Nutri-Score.
After the initial findings were presented, the team recruited a statistician, Binghamton University Professor Serdar Atav, to perform subgroup analysis. Professor Atav ran statistical correlation tests on various combinations of independent variables and average Nutri-Score. For example, one of the categories analyzed was the average Nutri-Score versus the percent minority in each census tract for just the 39 Wegmans, Tops, and Price Chopper chain stores. Another category was the average Nutri-Score in local, non-chain stores, versus the percent of residents with a bachelor’s degree or higher within each census tract. Out of the over 100 correlations assessed, only a few outliers were statistically significant. However, because these outliers were not supported by similar correlations that were also significant, it is likely that they were only significant by chance. As an example, Professor Atav found a strong negative correlation between the average Nutri-Score at Price Chopper stores and the percentage of Hispanic/Latinx residents in census tracts. As the average Nutri-Score in Price Chopper stores in a census tract increased, the Hispanic/Latinx population decreased. However, this specific phenomenon was not found with any other ethnic or racial minorities for this particular chain, so no conclusions can be drawn from the data.
Although the subgroup analyses were not fruitful in proving any correlations between average Nutri-Score and various factors, the team was not done analyzing their data. The team noted that many people shop at grocery stores outside the census tract in which they live. Thus, the same analyses were conducted with average Nutri-Score and various demographic metrics from a census tract and all the other tracts surrounding it. Nothing of significance was discovered, although it was interesting to find that as the median income of a group of census tracts increased, the average Nutri-Score of the first ten items in Wegmans stores actually decreased. Again, however, no meaningful correlations were found between any demographic indicator and the average Nutri-Score of grocery stores in a particular area.
The researchers recognized that there exists a disparity in access to healthy foods in different neighborhoods largely based on race and income. But, they concluded, the healthfulness of featured food items in grocery stores does not vary significantly between neighborhoods, and thus, another factor may be to blame for this disparity. As most of the researchers are currently training to become family physicians, the researchers hope to present their findings at future conferences and ultimately determine whether health outcomes for patients can be improved based on which grocery stores they frequent.


